NewsBox
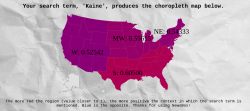
I worked with a partner at the end of my second semester in my Software Design class to create a web app that shows how the polarity (positivity) of tweets found using a given keyword varies in different regions of the US.
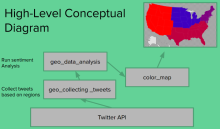
The project was Python-centric and quite simple. We collected tweets using python-twitter, analyzed the sentiment using Indico’s API, edited an SVG file of a map of the US using Beautiful Soup, and created a web application using Flask to fetch input and display output!
For more information about our project, check out our Github website. To use our web app, click here! Note: You have to refresh the map each time you search a new word after you search it. It always loads the last map first. Fun little quirk…

